
How to Compare Bike Geometry Before You Buy
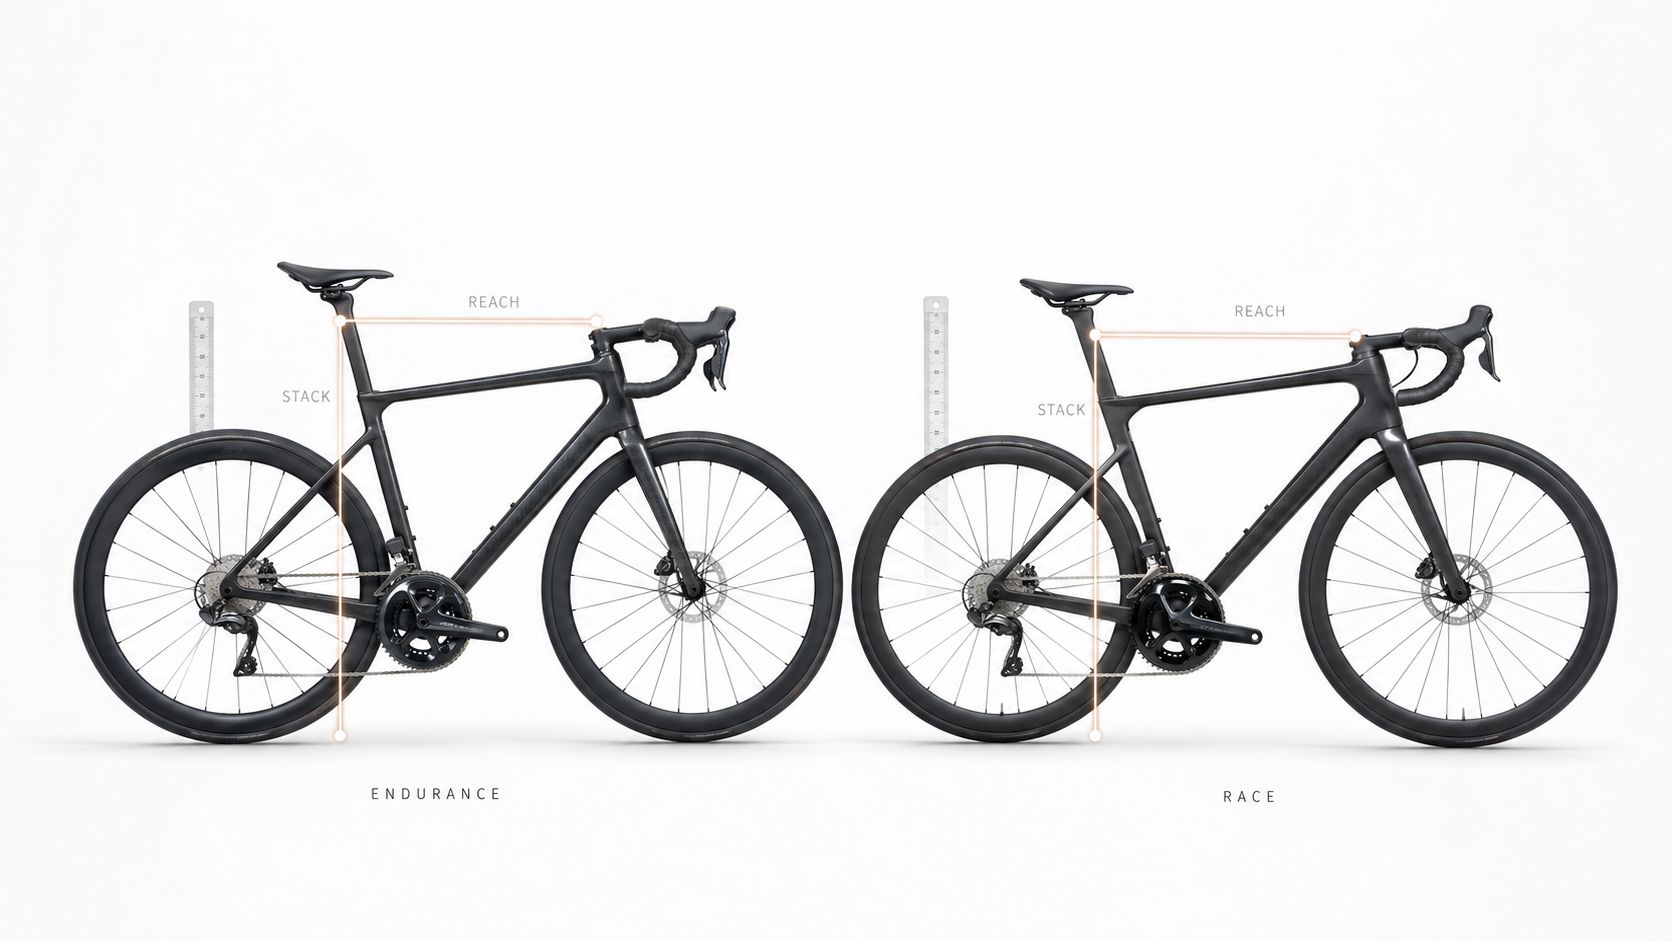
The best way to compare bike geometry before you buy is to treat it as a head-to-head workflow, not a size-label shortcut. Frame size filters the search. Geometry explains the ride. If you are comparing two bikes that both say 54, 56, or Medium, the geometry chart is what tells you why one bike feels lower, longer, steadier, or more manageable than the other.
That is where many buyers get stuck. Two listings can look similar on price, category, and frame size, yet still put the rider in very different positions and deliver very different handling. One may be a race road bike with a lower front end and a longer cockpit. The other may be an endurance road bike or gravel bike built around a taller front end, steadier handling, and more tire room.
This article is not a bike size calculator, a frame size guide, or a stack-and-reach explainer on its own. It is a practical guide to comparing two or more actual bikes before you buy, so you can decide which listing deserves to stay on your shortlist.
Table of Contents
-
The Supporting Geometry Numbers That Complete the Comparison
Why Frame Size Is Not Enough for a Smart Comparison
A frame size label is useful. It is not precise.
That matters because brands do not build around one universal meaning of 54cm, 56cm, or Medium. A race bike, endurance bike, and gravel bike can all carry the same size label while placing the rider in noticeably different positions. The sticker narrows the search. It does not explain the ride.
Why same-size bikes can fit differently
A common shopping situation is two used road bikes, both listed as 56cm. One comes from a race-focused model line. The other comes from an endurance-focused model line. On a marketplace page, they can look interchangeable.
They are not.
The race bike may put you lower and longer. The endurance bike may put you more upright, with calmer steering and more tire room. If your goal is fast group rides and a more aggressive front end, the race bike may fit the brief. If your goal is longer rides and less cockpit strain, the endurance bike may be the better match.
Practical rule: Frame size filters the search. Geometry explains the ride.
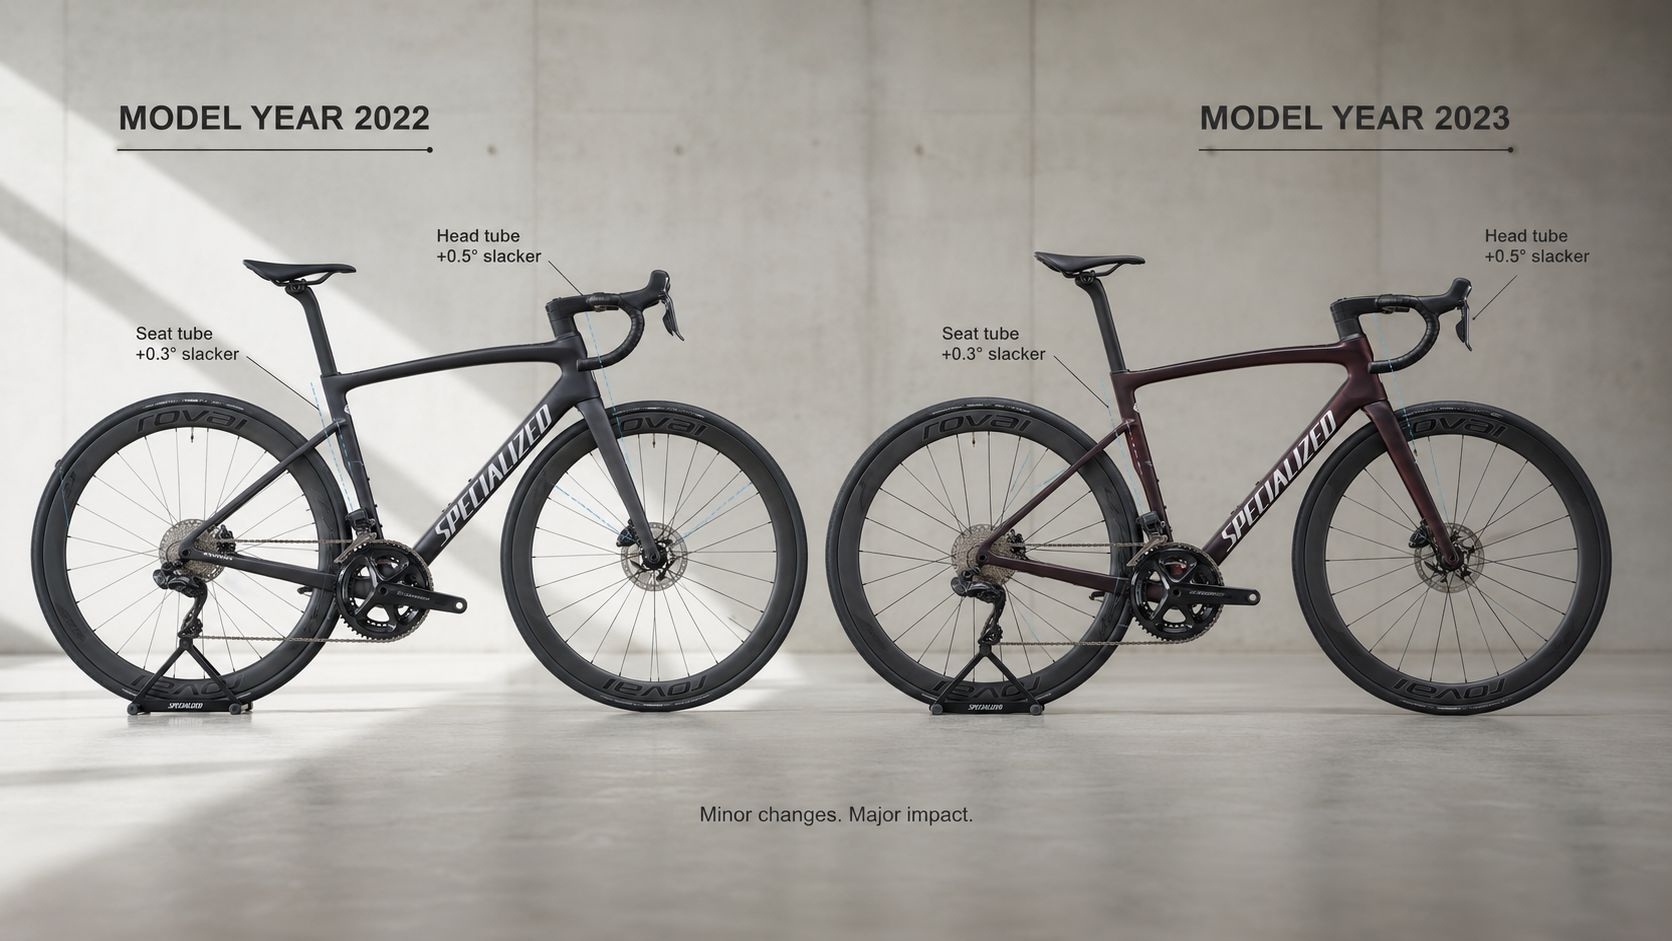
Model year matters too. Brands revise geometry over time, sometimes subtly and sometimes significantly. If you compare the wrong model year, you can think you are looking at the same fit profile when you are not.
Geometry is the real comparison tool
When riders ask how to compare bike geometry, the answer is not to memorize every number on a geometry chart. It is to compare the right numbers in the right order.
Start with stack and reach because they provide the clearest frame-to-frame comparison of rider position across brands, as explained in Canyon’s road bike geometry explainer. Then keep going. A good geometry comparison also checks standover, effective top tube, seat tube angle, handling-related dimensions, tire clearance, model year, and the complete build shown in the listing.
If you already know the position that works well for you, even from a current bike rather than a formal fit, use that as your anchor. A known reference bike is often more useful than guessing from height alone. If you want a separate overview of fit context before comparing listings, SYCLR’s bike stack and reach guide explains why those two numbers are useful but not sufficient on their own.
The Simplest Order for Comparing Bike Geometry
The simplest geometry comparison order:
Confirm the exact bike: brand, model, year, and size.
Compare stack and reach for rider position.
Check standover for practical fit.
Compare wheelbase, chainstay length, head tube angle, and trail for handling.
Check tire clearance for intended use.
Review the complete build: stem, spacers, handlebar, saddle position, wheels, and tires.
Decide whether the listing fits the rider, the use case, and the price.
That order keeps the comparison practical. It stops you from getting lost in numbers that matter less than the bike’s actual position, handling pattern, and real-world setup.
Start With Stack and Reach, Then Keep Going
If you only compare two geometry numbers first, compare stack and reach.
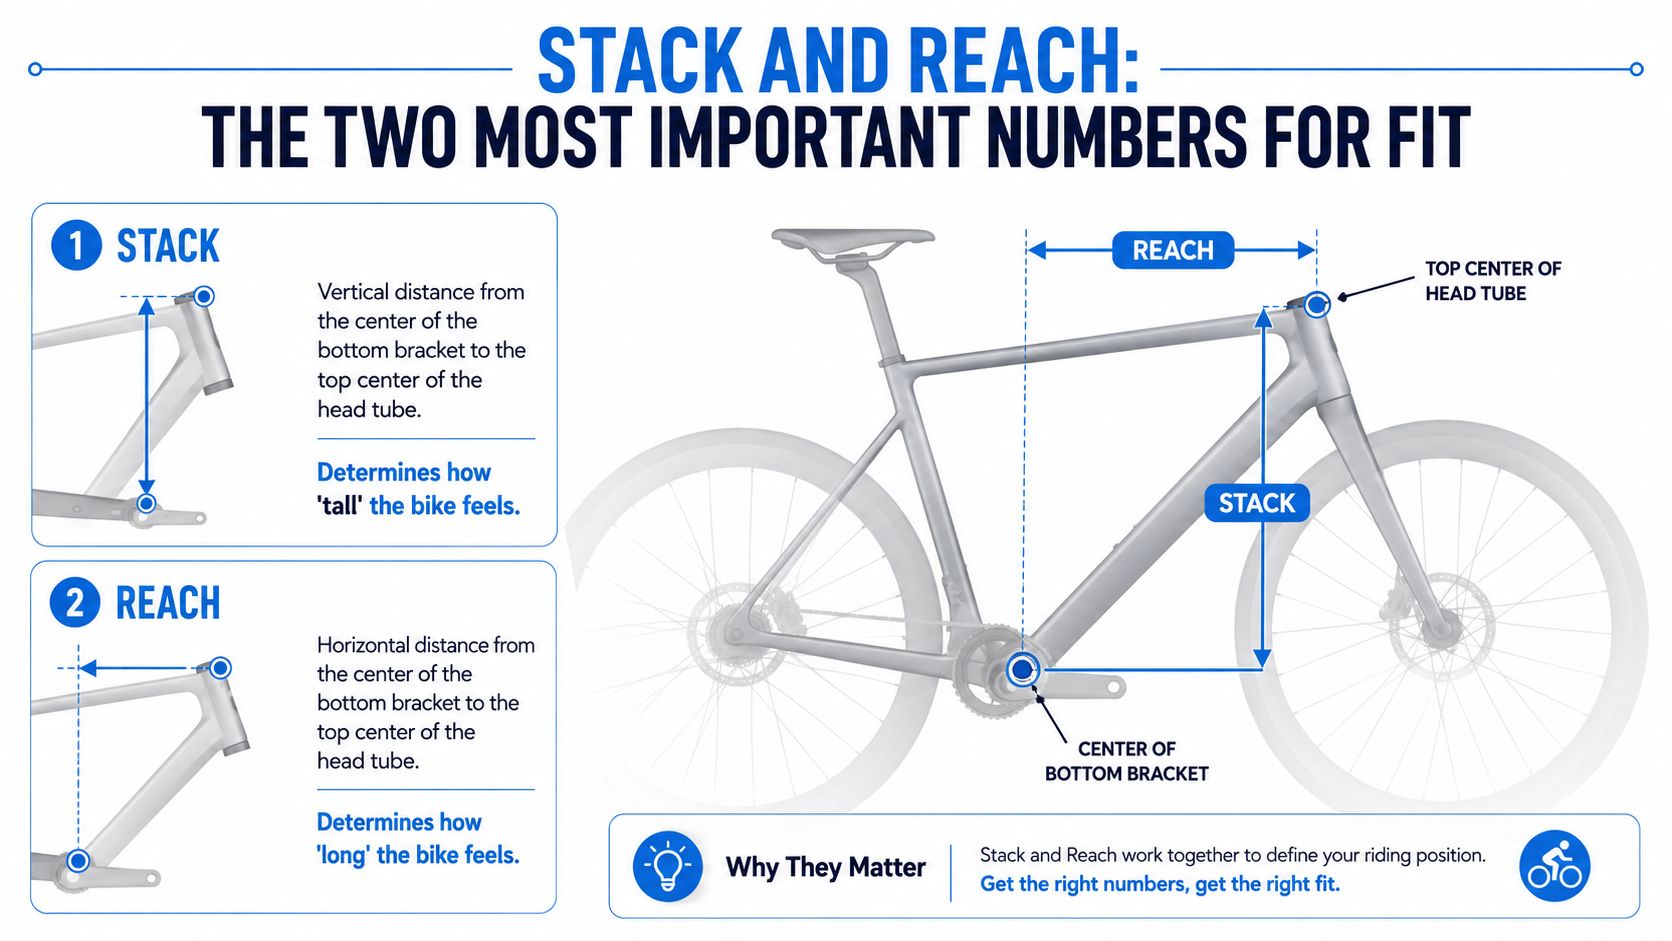
According to Canyon’s road bike geometry explainer, stack and reach define the vertical and horizontal relationship between the bottom bracket and the top of the head tube, which makes them the most reliable way to compare frame shape across brands. SYCLR’s own stack and reach guide makes the same practical point: higher stack and shorter reach generally mean a more upright, less stretched starting position, while lower stack and longer reach generally point toward a lower, more aggressive one.
What stack tells you
Stack is the vertical distance from the bottom bracket to the top center of the head tube.
In practical terms, stack tells you how tall the front of the bike is. More stack usually means a taller front end and a more upright starting point. Less stack usually means a lower front end and a more aggressive position.
That is why stack is often the first number worth checking when a rider says they want the next bike to feel less slammed or more manageable without using a tall stack of spacers.
What reach tells you
Reach is the horizontal distance from the bottom bracket to the top center of the head tube.
This tells you how long the frame is through the front triangle. More reach usually points toward a longer cockpit. Less reach usually points toward a more compact feel.
Reach becomes especially useful when two bikes share the same listed size but one consistently looks or feels stretched. Side-by-side reach numbers often explain that difference immediately.
Why stack and reach are not the whole comparison
Stack and reach come first, but they do not finish the job.
A buyer can easily compare stack and reach correctly and still choose the wrong bike if they ignore standover, seat tube angle, handling signals, tire clearance, or the actual build in the listing photos. Stack and reach describe the frame well, but the final fit still depends on details like stem length, spacers, handlebar reach, and saddle setup, which SYCLR’s stack and reach guide also notes.
Use this quick table as a starting point:
| Comparison point | What to compare first | What it usually tells you |
|---|---|---|
| Rider position | Stack | How tall or low the front end starts |
| Cockpit length | Reach | How long or compact the bike feels |
| Cross-brand comparison | Stack + reach together | Whether same-size bikes are actually similar |
| Practical fit | Standover | Whether the bike will feel manageable when stopping and standing over it |
| Fallback if data is missing | Effective top tube | Useful rough sizing backup, but less precise than stack and reach |
If a listing does not provide stack and reach, the fallback is often effective top tube. Bike Stats notes that horizontal effective top tube length is the best backup when stack and reach are missing, although it is less precise for cross-brand comparisons. That same database now includes 44,815 distinct geometry records, which shows how broad geometry comparison has become across road, gravel, and mountain bikes (Bike Stats geometry database).
The Supporting Geometry Numbers That Complete the Comparison
Once stack and reach tell you whether a bike belongs on the shortlist, the rest of the geometry chart tells you why it may ride the way it does and whether it really suits the rider.
Standover and effective top tube
Standover height still matters because buyers need to stand over the bike confidently, especially at stops, on uneven ground, or when a used-bike purchase happens without a test ride.
Effective top tube still matters too, especially in older listings where stack and reach are missing. It is not the best primary comparison metric across brands, but it remains useful as a supporting number when geometry charts are incomplete.
Seat tube angle and rider position
Seat tube angle matters because it changes where the rider sits relative to the bottom bracket. Two bikes can have similar stack and reach numbers but feel different once saddle position, setback, and cockpit setup are accounted for.
That is why seat tube angle belongs in a full geometry comparison even when stack and reach look close.
Handling numbers and ride character
This is where buyers should think in patterns rather than isolated rules.
Wheelbase is a useful shorthand for overall stability and directional feel. Chainstay length influences rear-end feel and contributes to whether the bike seems more stable or more reactive. Head tube angle is one of the most common clues for steering character. The Pro's Closet reports average head tube angles of 72.62 degrees for road bikes, 71.57 degrees for gravel/cross bikes, and 67.79 degrees for mountain bikes, which helps show how categories trend toward quicker or calmer steering (The Pro's Closet geometry overview).
Fork rake, trail, head tube angle, and wheelbase work together to shape steering feel. You do not need to calculate each one as a beginner buyer, but you should understand the pattern: some bikes are designed to feel quicker and more responsive, while others are designed to feel calmer and more stable.
Bottom bracket drop also belongs in the comparison, but as a supporting signal, not a single-number verdict. It influences how planted the bike feels and how much clearance it has, especially when a bike is built for different surfaces and tire sizes.
Tire clearance and intended use
Tire clearance is one of the easiest ways to eliminate the wrong listing quickly. A bike can look good on paper, but if it cannot take the tires you want for rough pavement, all-road riding, or gravel use, it may not belong on the shortlist.
That is also where category matters. A race road bike, endurance road bike, and gravel bike can overlap in fit range while being designed for different tire sizes, surfaces, and handling priorities.
Example: Two 56cm Road Bikes
A practical comparison works better than theory alone. Here is a simple side-by-side example of how two bikes with the same size label can tell very different stories.
| Comparison point | Race-oriented 56cm | Endurance-oriented 56cm | Why it matters |
|---|---|---|---|
| Stack | Lower | Higher | A lower front end usually creates a more aggressive position. A higher front end usually supports a more upright setup. |
| Reach | Longer | Shorter | Longer reach often feels more stretched. Shorter reach often feels easier to manage. |
| Wheelbase | Shorter | Longer | Shorter wheelbase can feel quicker. Longer wheelbase often feels calmer and steadier. |
| Tire clearance | Narrower | Wider | Wider clearance gives more flexibility for rough roads, comfort, and all-road use. |
| Best fit for | Fast road riding, aggressive front end, sharper handling preference | Longer rides, comfort-first road riding, rougher pavement, more versatility | The same size label can still point to very different ride experiences. |
This kind of table helps buyers stop treating 56cm as the answer and start reading what the bike is actually built to do.
A Practical Workflow for Comparing Two Bikes
The most useful bike geometry comparison is not abstract. It is listing against listing.
Start with a realistic example. You are comparing two road bikes, both labeled 56cm. One is race-oriented. The other is endurance-oriented. Prices are close enough that geometry becomes the deciding factor.
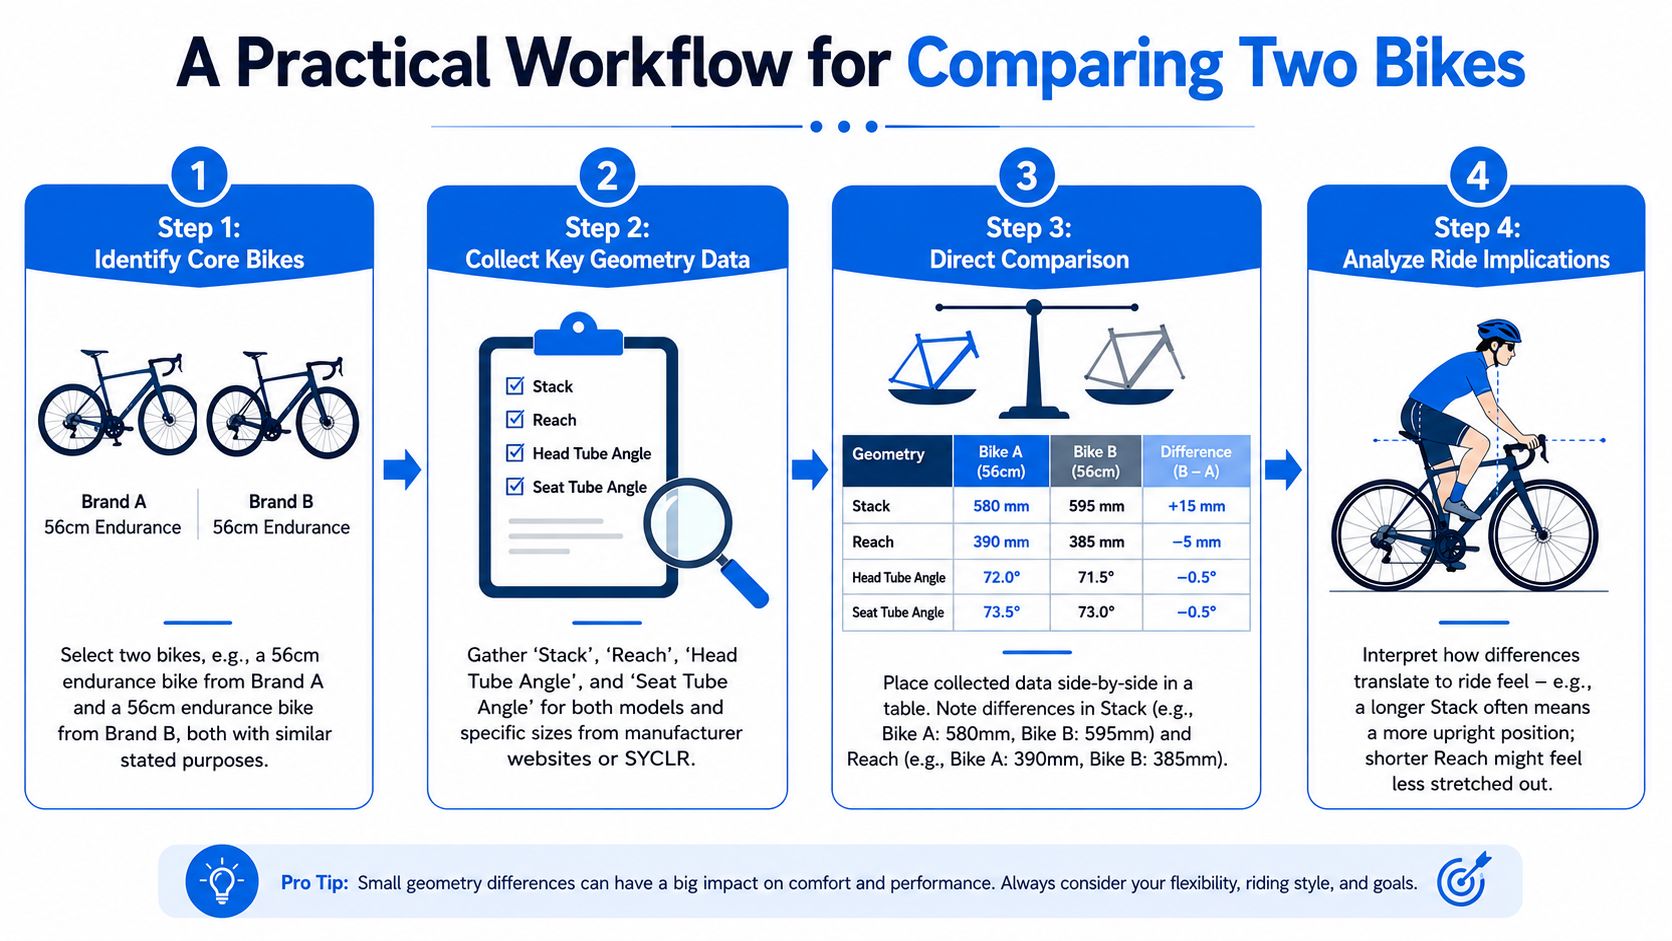
Step 1 confirms the exact bike
Begin by confirming the exact listing details: brand, model, model year, and size.
This sounds basic, but it is where many geometry comparisons go wrong. A seller may use the right model name and the wrong year. A used bike may have changed brakes, wheels, or tires. If the year is wrong, the chart may be wrong too.
Step 2 compares rider position first
Compare stack and reach before anything else.
If one bike has clearly higher stack, it likely starts with a taller front end. If it also has shorter reach, it is telling you a clear position story: more upright and less stretched. If the other bike is lower and longer, it is telling the opposite story.
A useful extra check is the stack-reach ratio. Bike Stats describes this ratio as a quick way to show whether a frame trends more aggressive or more conservative, with a higher ratio generally indicating a taller, more conservative shape and a lower ratio generally indicating a longer, more aggressive one (Bike Stats stack-reach ratio reference).
Step 3 checks practical fit and handling
Now add the supporting numbers that complete the comparison.
-
Standover: Especially important if you are near a size boundary or buying used without a test ride.
-
Seat tube angle and effective top tube: Useful for understanding how the rider's position may change once the saddle is set correctly.
-
Wheelbase and chainstay length: Helpful for spotting whether a bike trends quicker or calmer.
-
Head tube angle, trail, and fork rake: Use them as handling clues, not rigid verdicts.
-
Tire clearance: Essential for deciding whether the bike matches the surfaces and tires you actually want to ride.
If two listings share the same size label but differ in stack, reach, wheelbase, or tire clearance, do not treat them as the same bike in real-world terms.
Step 4 reviews the complete build before deciding
Before you keep a bike on the shortlist, review the complete build, not just the frame chart.
Look closely at:
-
Stem length
-
Spacer height
-
Handlebar shape and reach
-
Saddle position and setback
-
Wheel and tire setup
Geometry charts describe the frame. Riders experience the complete bike. A listing with an unusually long stem, a slammed spacer setup, or narrow tires can feel very different from what the geometry chart alone suggests.
Common Pitfalls When Comparing Geometry
Bike geometry charts are useful, but they can create false confidence when buyers compare them too narrowly.
Model year confusion
A bike name is not enough.
Brands revise geometry, rename categories, and shift fit philosophy over time. A listing with the right model name and the wrong year can send you to the wrong chart and lead to the wrong conclusion.
Always verify the exact year if possible. If the seller does not know, compare paint, frame details, brake type, axle standard, and manufacturer archives before trusting any geometry chart.
Comparing charts without comparing the built bike
This is one of the easiest mistakes to make.
Two frames can look similar on paper, but the actual listing may have a different stem, a different spacer stack, different handlebar dimensions, or a tire setup that changes how the bike feels in practice.
Use this quick check before keeping a bike on the shortlist:
-
Check the chart: Confirm the correct year, model, and size.
-
Check the build: Review stem, spacers, bar setup, saddle position, wheels, and tires.
-
Check the category: Compare race road, endurance road, and gravel bikes with their intended use in mind.
-
Check the listing quality: Weak photos and vague specs make every geometry conclusion less reliable.
Confusing category differences with sizing differences
A gravel bike is not just a road bike with wider tires, and an endurance bike is not just a race bike in a bigger size.
Sometimes what looks like a sizing issue is actually a category difference. The geometry can be intentionally taller, steadier, longer, or more versatile because the bike was designed for a different riding job.
How SYCLR Helps You Compare Bike Listings
Manual geometry comparison works. It just gets slow once you are juggling multiple tabs, mixed-quality seller listings, and incomplete geometry charts.
That is where a fit-aware comparison workflow becomes more useful.

How SYCLR helps
SYCLR is built for road and gravel cyclists who want more than a basic marketplace search. It helps riders compare listings using fit signals, geometry signals, price context, model year, listing quality, and confidence signals so they can reduce guesswork before clicking through to a seller.
That matters when two bikes look similar on price and frame label but differ in the numbers that affect rider position, handling, intended use, and buying confidence.
If you are earlier in the process and need background on stack and reach before comparing listings, SYCLR's bike stack and reach guide can help. If you are comparing road or gravel bikes now, start with your height, bike type, and budget in the SYCLR app. SYCLR helps you shortlist better-fit bikes before you buy.
Frequently Asked Questions About Bike Geometry
Is stack and reach comparison enough to choose a bike?
No. Stack and reach are the first comparison points because they give the clearest cross-brand picture of rider position, but they are not the whole decision. Standover, seat tube angle, handling-related numbers, tire clearance, model year, and the actual build still matter.
Can two bikes with the same frame size fit very differently?
Yes. That is one of the main reasons to compare bike geometry before buying. Two bikes with the same size label can differ in front-end height, cockpit length, handling character, tire clearance, and intended use.
Is effective top tube still useful?
Yes, mostly as a fallback. When stack and reach are missing, effective top tube can help compare bike sizes. It is less precise across brands because other frame dimensions can change how that number feels on the bike.
Is standover height still important?
Yes. Standover height is often overlooked, but it still matters for practical fit and day-to-day confidence, especially for first-time buyers, riders near a size boundary, and anyone shopping for a used bike without a test ride.
How do road and gravel geometry usually differ?
Gravel bikes usually prioritize stability and versatility more than race road bikes do. That often shows up in handling patterns, tire clearance, wheelbase, and overall setup. The category trend in head tube angles reported by The Pro's Closet helps illustrate that difference, but buyers should compare the full chart and the complete build rather than relying on one number.
Can I use a professional bike fit when comparing listings?
Yes. A professional fit can be very valuable because it gives you a known reference for your current position and fit details. SYCLR does not replace a professional fit, but riders who already know what works well for them can use that context to compare listings more accurately.
How can I find geometry for older or used bikes?
Start with the manufacturer's archive if it exists, then cross-check the exact year and size carefully. Older listings often have incomplete or incorrect details. If stack and reach are unavailable, compare the best available geometry chart, verify the model year from photos, and treat vague listings with caution.
If you are comparing road or gravel bikes now, start with your height, bike type, and budget in the SYCLR app. SYCLR helps you compare listings by fit signals, geometry signals, price context, model year, listing quality, and confidence signals so you can shortlist better-fit bikes before you buy.