How Bike Geometry Changes Between Sizes
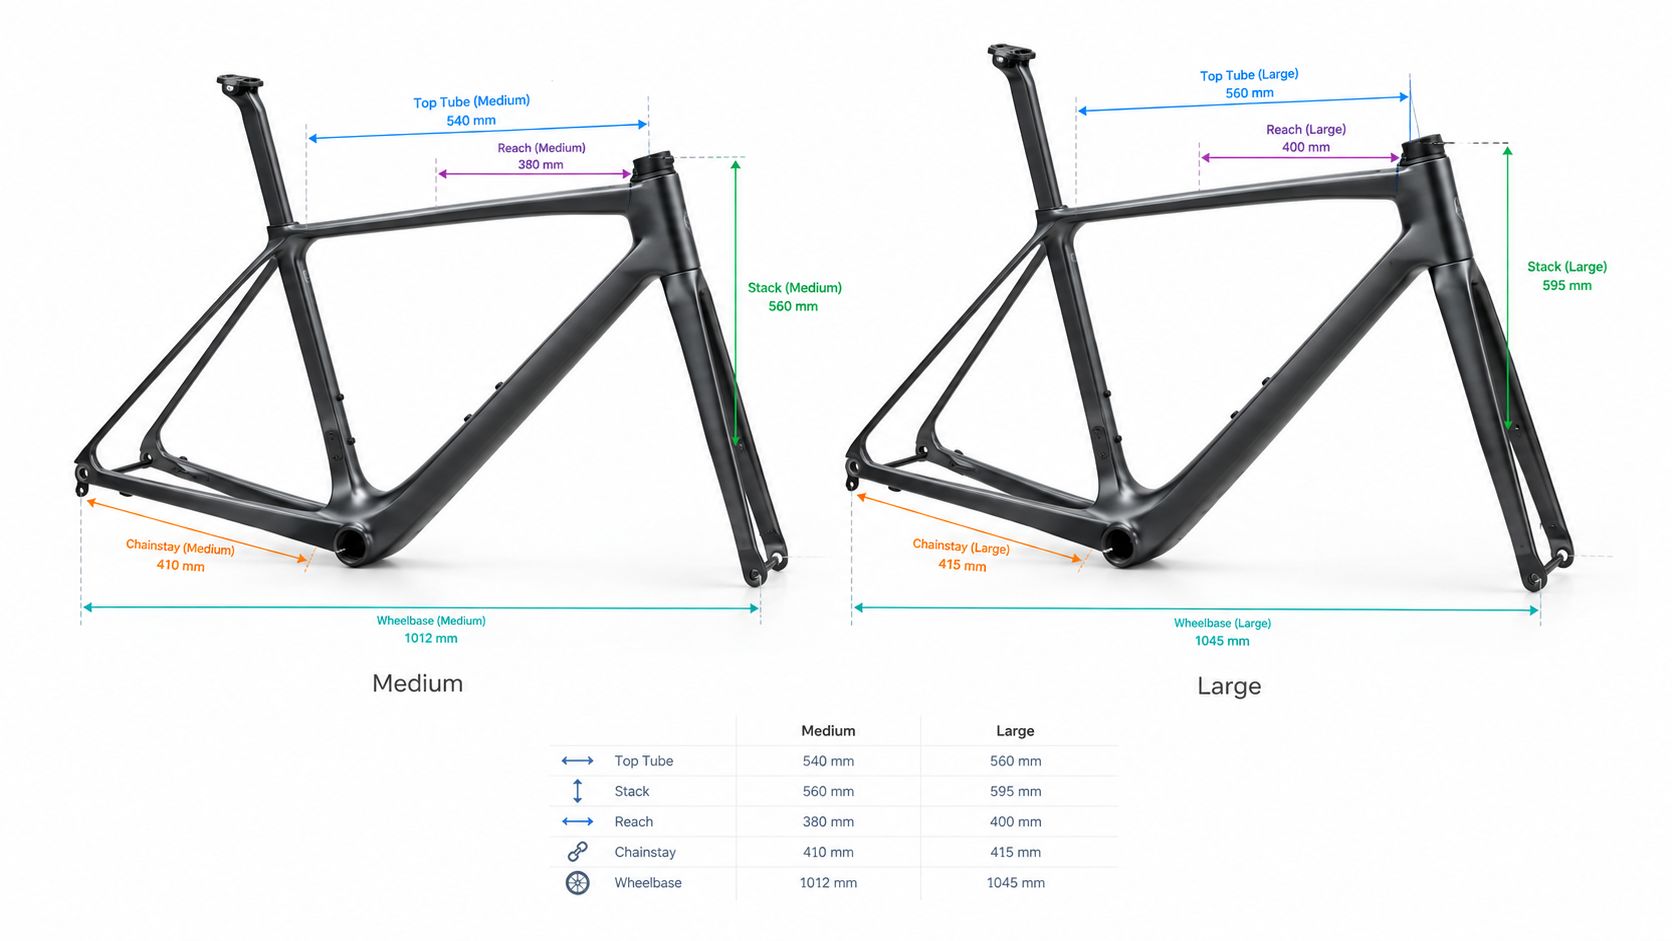
What changes when you move from a Medium to a Large, or from a 54 to a 56? Not just the height of the seat tube. A size change can alter the frame's stack and reach coordinates, head-tube length, wheelbase, front-center, rear-center, and sometimes angles or bottom-bracket position. A bike can carry the same model name across its range yet still differ meaningfully from one size to the next.
That matters when you're comparing a new listing with your current bike, shopping used, or deciding between adjacent sizes. A good deal is only a good buy if the frame's geometry suits your body and riding goals. Price, components, condition, and model year still matter, but geometry is the part you cannot replace after purchase.
Table of Contents
- What Changes Between Sizes
- The Geometry Numbers That Matter
- How Stack and Reach Shift Across Sizes
- Patterns You May See Across a Size Run
- Handling and Fit Consequences
- Reading Geometry Charts and Using SYCLR
- Comparing Adjacent Sizes
What Changes Between Sizes
A frame range grows in more than one direction. The front of the bike often gets taller and longer, while the relationship between the wheels, bottom bracket, and steering axis may also change. That is why a Medium and a Large of the same road or gravel model should not be treated as identical bikes with different seat-tube lengths.
The clearest changes often appear in stack, reach, head-tube length, effective top tube, front-center, wheelbase, and sometimes in angles or bottom-bracket drop. Some of those fields move in steady steps. Others stay nearly fixed for several sizes, then change at one point in the range. The important point is that a geometry chart shows a size run as a series of related but distinct frames, not a single frame enlarged evenly.
Geometry charts make these shifts visible. Canyon's current Grail geometry chart, for example, lists 545 mm stack and 372 mm reach in 2XS and 633 mm stack and 435 mm reach in XL on the manufacturer's geometry chart, as shown in Canyon's road-bike geometry explanation. That is an attributed within-model example, not a rule for other bikes. It simply shows that height and length do not move as one uniform block across a size run.
Three directions of frame growth
Think of a size change in three practical zones:
-
Along the rider: Stack, reach, effective top tube, and head-tube length change the frame's position coordinates relative to the bottom bracket.
-
Around the rider: Seat angle and cockpit-related proportions help describe how the frame places its front triangle and contact-point references.
-
Under the rider: Front-center, rear-center, wheelbase, and bottom-bracket position describe how the chassis is arranged between the axles.
Some dimensions change at nearly every size step. Others stay almost constant because the chart is preserving one relationship while allowing another to move. A few may change only in certain parts of the range.
Practical rule: Compare the complete geometry row for each size. A seat-tube label tells you where a bike sits in a size range, not how the rest of the frame is arranged.
This is the central point behind how bike geometry changes between sizes. The important question is not only, "Which label matches my height?" It is, "How does each geometry row differ from the next one in the same model?"
The Geometry Numbers That Matter
A geometry chart can look like a spreadsheet of cryptic measurements. It becomes easier to read once you separate frame-position fields from chassis and front-end fields.
Frame-position fields
Stack measures the vertical distance from the bottom bracket to the top of the head tube. It is a frame coordinate, not a final handlebar height.
Reach measures the horizontal distance between those same points. It is a frame coordinate, not a final hand position.
Effective top tube is the horizontal reference used on many older or mixed geometry charts. It can help describe front-triangle proportions, but sloping top tubes make it less consistent than stack and reach as a cross-brand comparison field.
Seat angle is supporting geometry context. It helps describe how the frame's front triangle is arranged relative to the bottom bracket, and it can affect how other dimensions relate to one another on the chart.
Chassis and front-end fields
Head angle describes the steering axis relative to the ground.
Fork offset, also called rake, is the forward distance between the steering axis and the fork axle.
Trail is derived from head angle, fork offset, and wheel size. It belongs with the front-end package rather than as an isolated number.
Front-center describes the relationship between the bottom bracket and front axle, but the exact measurement convention matters; some geometry sources distinguish general front-center from front-center horizontal.
Rear-center describes the bottom-bracket-to-rear-axle relationship and is commonly represented by published chainstay length, according to the manufacturer’s measurement convention.
Wheelbase is the distance between the front and rear axles.
Bottom-bracket drop describes how far the bottom bracket sits below the axle line.
No single geometry number predicts complete handling. Interpret changes with the full geometry package, rider position, tire/wheel setup and load. The Bike Geometry Chart guide is useful when you need to identify what each field means before comparing listings.
How Stack and Reach Shift Across Sizes
When people compare adjacent sizes, stack and reach are often the first two numbers they notice. That makes sense because they are the clearest frame-position coordinates on most modern charts. But the useful comparison is not one number in isolation. It is how both fields change from one size row to the next.
A size run may add more stack than reach, more reach than stack, or near-even increments of both. Another model may show irregular jumps, where one adjacent size adds very little in one field but more in another. Those deltas tell you how the frame family is actually scaling.
Why stack and reach should be read together
Stack and reach describe the frame before stem, spacers, handlebar shape, and other setup choices are added. That is why they are useful for chart comparison. They let you see whether one adjacent size moves upward, forward, or both.
A frame with more stack does not automatically place the bars at a fixed higher riding position, and a frame with more reach does not automatically create a stretched position. Final contact-point location depends on the complete setup. What stack and reach do provide is a clean reference for how the bare frame changes across the size run.
Read the delta, not one number
The most useful habit is to compare each size against the one directly above or below it:
-
How much does stack change?
-
How much does reach change?
-
Does effective top tube move by a similar amount?
-
Does head-tube length change in step with stack, or more sharply?
-
Do front-center and wheelbase move in parallel, or does one stay flatter?
-
Do angles remain constant, or do they shift at a particular size?
This is how you read size-to-size deltas. You are not just asking whether one size is bigger. You are asking how it is bigger, and in which parts of the geometry row the change actually happens.
Patterns You May See Across a Size Run
Not every model family scales in the same way. The patterns below are descriptive labels for what a shopper may see in a chart. They are not formal industry classifications, and they do not necessarily describe manufacturer intent.
Proportional pattern
In a proportional pattern, several major dimensions increase in fairly even steps across the size run. Stack, reach, and wheel-related fields may all progress gradually from one row to the next. The chart reads as a steady expansion rather than a series of abrupt shifts.
Mixed pattern
In a mixed pattern, some dimensions move clearly while others stay nearly fixed. For example, stack and head-tube length may change from size to size while rear-center remains constant, or reach may move in small steps while front-center changes more noticeably.
Progressive pattern
In a progressive pattern, the jumps are not uniform across the whole range. The smaller sizes may change one way, while the larger sizes show a different rate of change. A chart may also show one field staying stable for several rows, then stepping at one point.
Read the jumps: A column that changes sharply between adjacent sizes is more likely to reshape that frame row than a column that stays nearly flat.
Handling and Fit Consequences
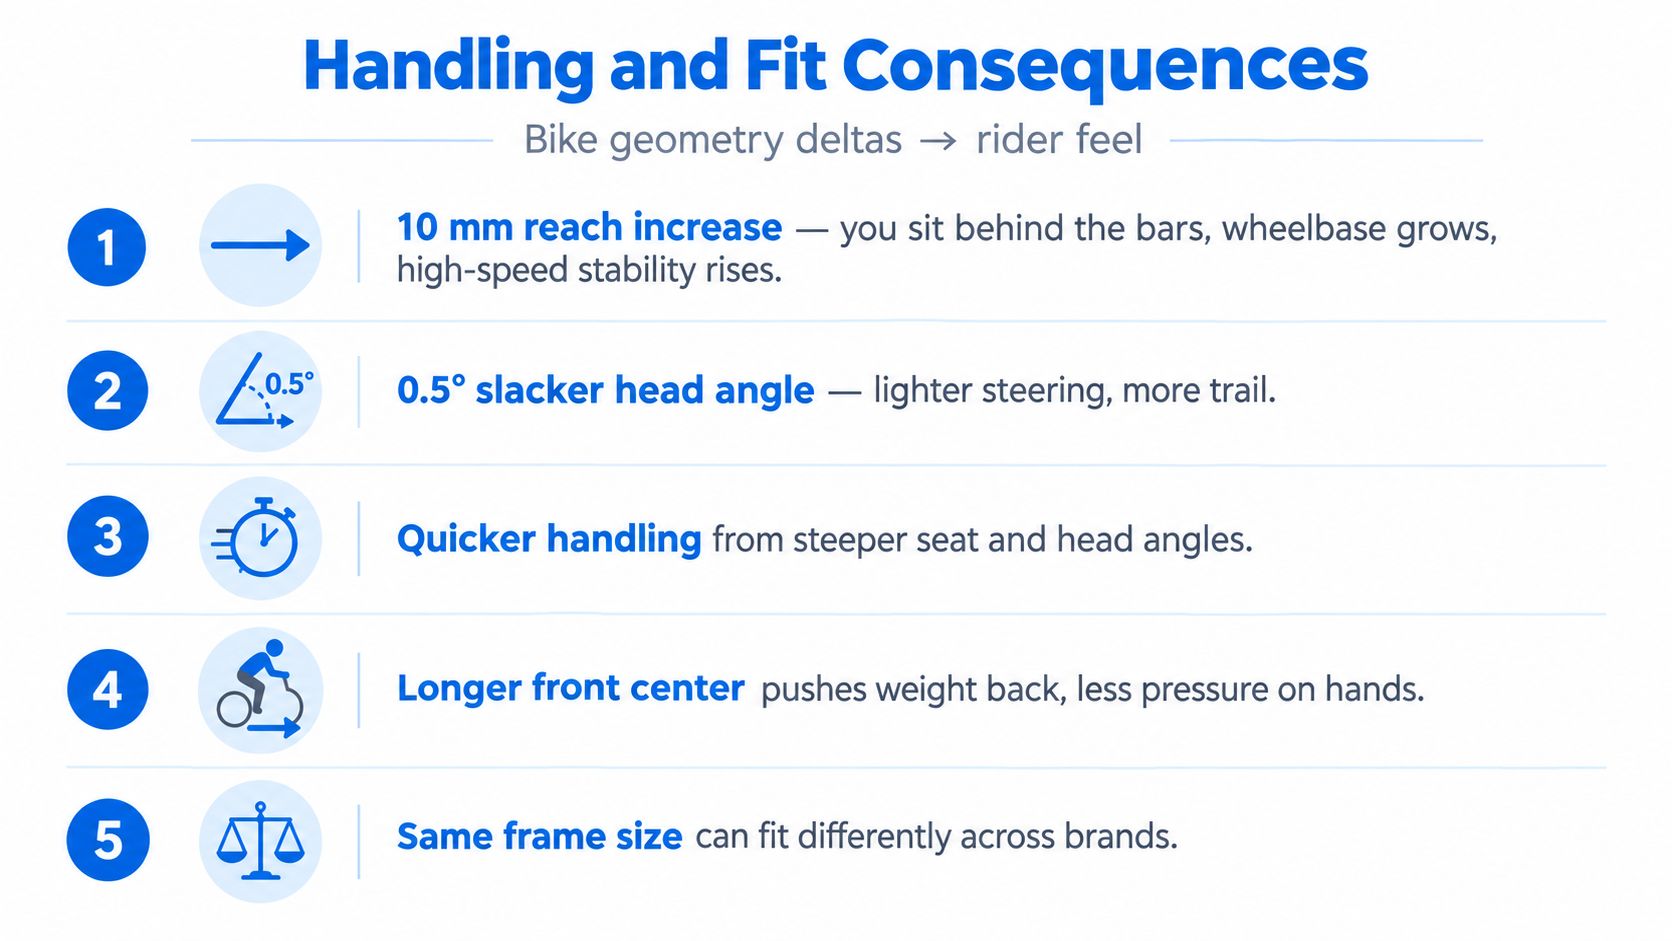
Geometry changes become meaningful when they alter the full relationship between the rider, the front end, and the wheelbase package. That is why adjacent sizes are not scaled copies. Even when the model name, tube shapes, and category stay the same, the geometry row may change by different amounts in different fields.
Why adjacent sizes are not scaled copies
One adjacent size may add stack with only a small change in reach. Another may increase reach, front-center, and wheelbase together while holding another field constant. In some ranges, head angle, seat angle, or bottom-bracket drop also change. In others, those values remain fixed while linear dimensions do the work.
Those differences matter because a bike's on-road or off-road behavior does not come from one number alone. No single geometry number predicts complete handling. Interpret changes with the full geometry package, rider position, tire/wheel setup and load.
Short stems, spacers, saddle setup, and handlebar dimensions can refine a suitable frame. They do not erase the underlying differences between one geometry row and the next.
Reading Geometry Charts and Using SYCLR
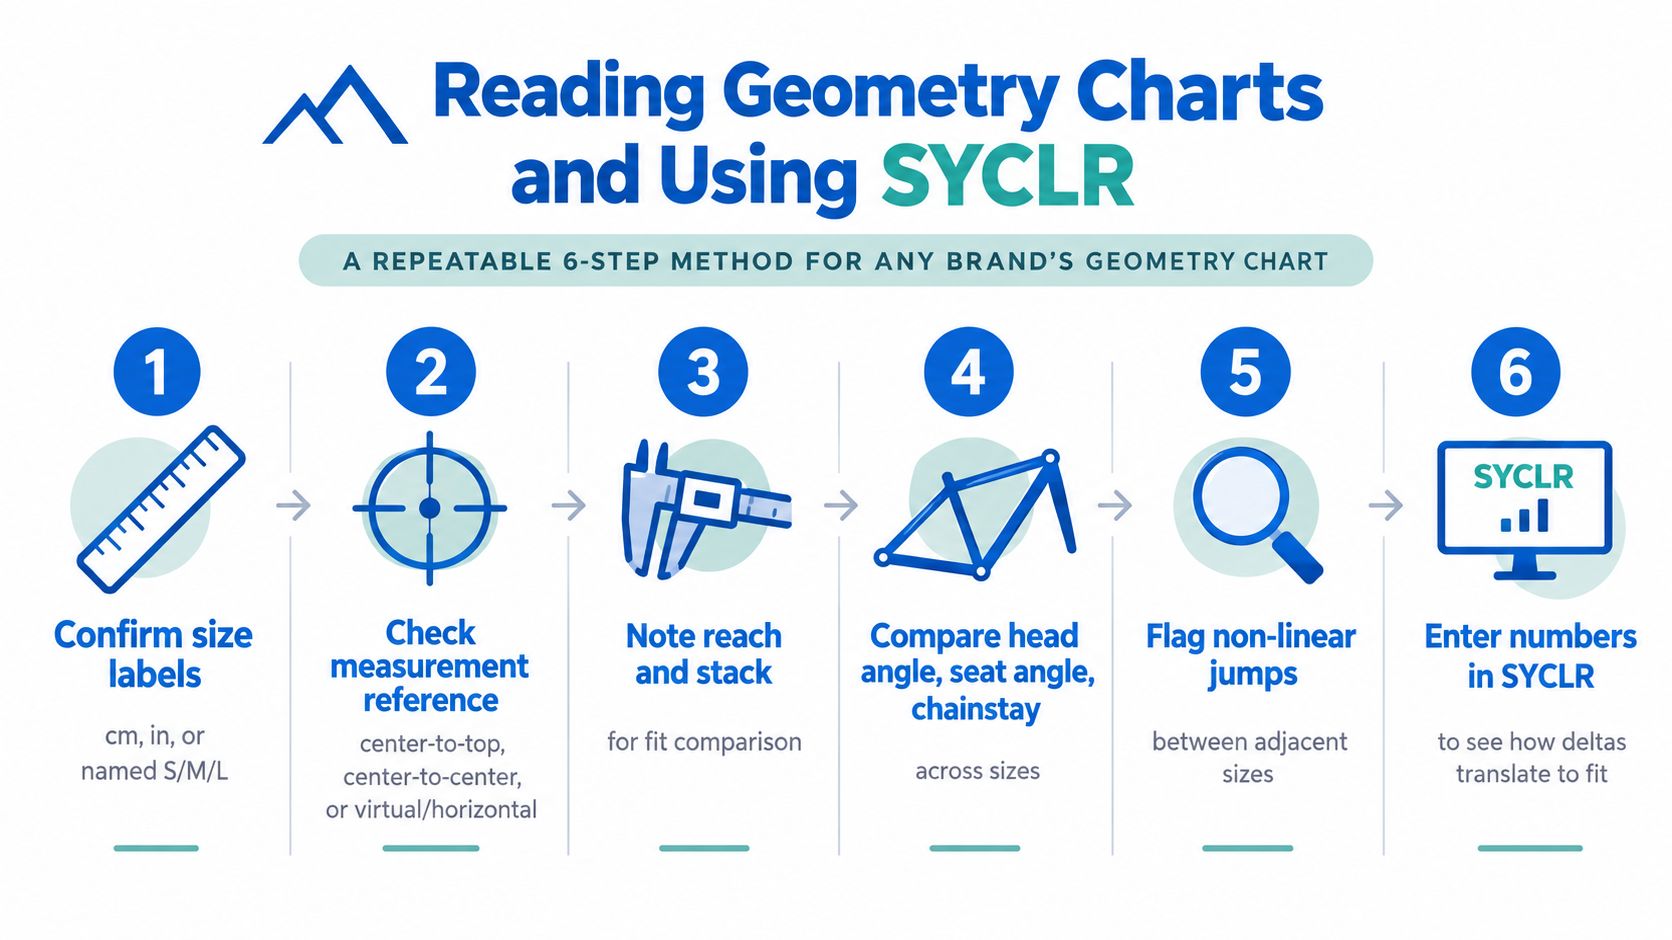
Start with the chart, not the size label. Confirm whether the manufacturer uses centimeters, inches, or named sizes such as Small, Medium, and Large. Then check whether measurements are center-to-top, center-to-center, or virtual, especially for effective top-tube figures.
A repeatable chart-reading method
-
Confirm the labels: Make sure adjacent sizes are comparable.
-
Check the reference: Note how the manufacturer defines each measurement.
-
Record frame-position fields: Start with stack, reach, effective top tube, and seat angle.
-
Record chassis and front-end fields: Then read head angle, fork offset, trail, front-center, rear-center, and wheelbase together.
-
Flag uneven jumps: A sudden change between adjacent sizes may alter how that geometry row differs from the next one.
-
Check setup room: Consider stem length, spacers, saddle position, and handlebar dimensions.
If one chart lists reach but omits stack, confidence drops. A reach number alone cannot tell you how the rest of the frame is arranged. The same warning applies to listings that provide a frame size but no geometry table.
SYCLR helps compare road and gravel listings using fit signals, geometry signals, model-year context, price context, listing quality, condition signals where available, and confidence signals. It does not replace a professional fit or mechanical inspection. The useful workflow is to enter the geometry you know, compare normalized listings, and treat missing data as uncertainty rather than silently filling in the gaps.
Comparing Adjacent Sizes
When two neighboring sizes appear close, keep the comparison anchored to the geometry rows themselves. Look at what changes, what stays constant, and where the biggest deltas appear. That is the clearest way to understand how a model's size run actually scales.
If two adjacent sizes both appear plausible, compare exact size-specific geometry, practical standover context, available cockpit adjustment and a known-good reference if available. Use SYCLR's Between Two Bike Sizes guide for the final decision.
SYCLR helps compare road and gravel listings using fit signals, geometry signals, model-year context, price context, listing quality, condition signals where available, and confidence signals. Open SYCLR to start with your height, bike type, and budget, or use detailed fit information when you already know your stack, reach, or current-bike geometry.