
Bike Geometry Chart: How to Read the Numbers Before You Buy
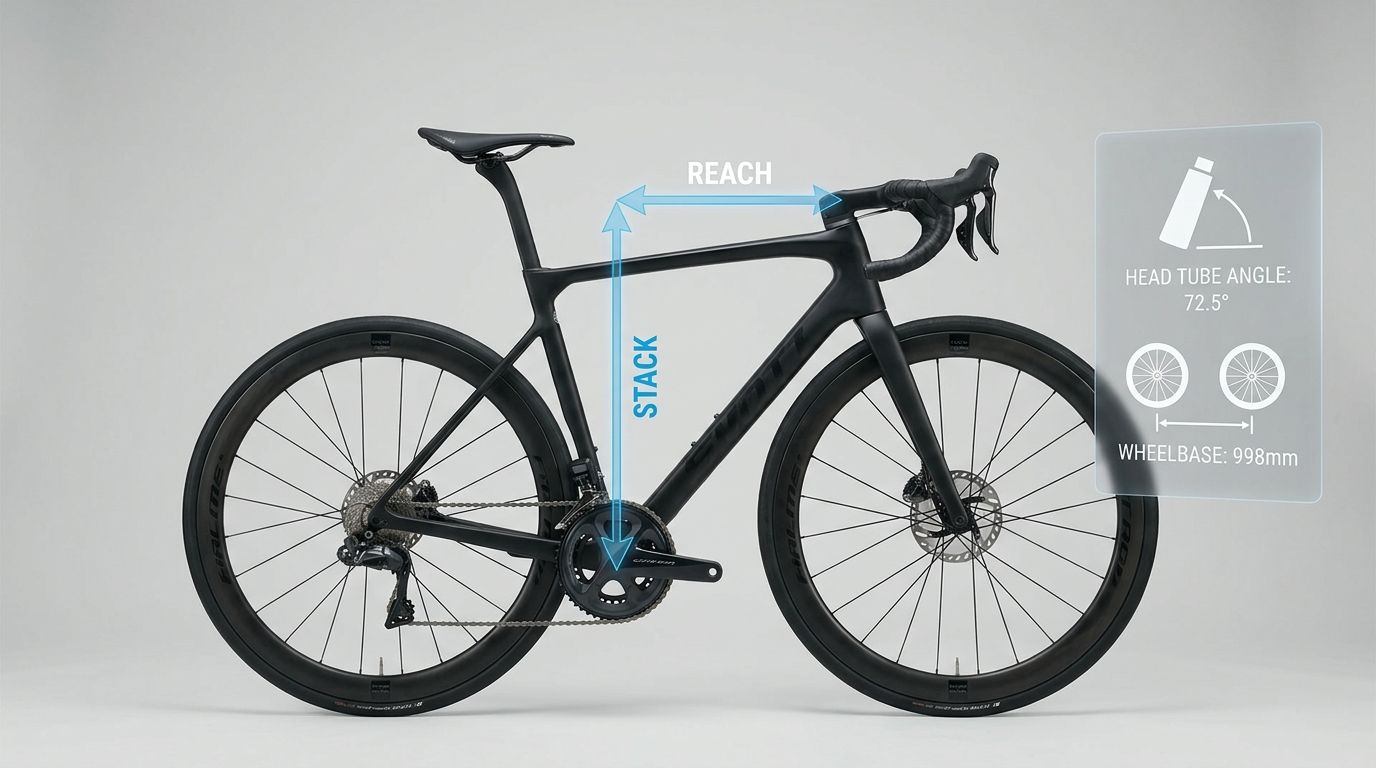
You’re looking at two bikes that both say 56 cm. One is sold as a fast road bike. The other is pitched as endurance-focused. The size label matches, the photos look close enough, and the prices are tempting. Then you open the bike geometry chart and the numbers stop feeling friendly.
That’s the moment where most buyers either close the tab or trust the size label and hope for the best. That’s also where expensive mistakes happen. A bike geometry chart isn’t just a spec table. It’s the closest thing you have to a map of fit, posture, handling, and intended use before you ride the bike.
If you know how to read a few fields well, you can stop guessing. You can tell why one bike will likely feel lower and longer, why another will feel calmer on rough roads, and why a gravel bike listing with the right frame size label may still be the wrong match for your body or riding goals.
Table of Contents
Why the Geometry Chart Matters More Than the Size Label
A customer in a bike shop usually starts the same way. “I ride a 56.” Then we pull up two geometry charts and find out those two 56s are not remotely the same bike.
One has a taller front end and a shorter cockpit. The other puts the rider lower and farther forward. On paper, both are “the right size.” On the road, they can feel completely different in the first few minutes.
That’s why the bike geometry chart matters more than the frame sticker. It tells you what the size label hides. It gives you the numbers behind riding position, weight distribution, steering character, and frame intent.
Practical rule: If two bikes share the same size label, assume nothing until you’ve looked at the geometry chart.
This matters even more when you’re shopping used, comparing listings from different brands, or trying to buy online without a test ride. A chart can tell you whether a bike is likely to feel compact or stretched, stable or quick, road-biased or mixed-surface ready.
The useful shift is this. Stop reading the chart like an engineer’s spreadsheet. Start reading it like a buyer’s decision tool. The point isn’t to memorize every field. The point is to know which numbers answer your actual question: Will this bike fit the way I want, and will it ride the way I expect?
Why Frame Size Alone Is Not Enough
Frame size is a label. A bike geometry chart is the substance behind it.
That label can be helpful as a first filter, but it doesn’t standardize anything across brands, categories, or even models from the same company. A medium gravel bike, a medium endurance road bike, and a medium race bike can all place the rider in noticeably different positions.
The easiest way to think about it is this. The frame size tells you the neighborhood. The geometry chart tells you the street layout, the climbs, the corners, and how the whole thing will feel once you’re on it.
The label doesn’t describe the ride
When riders trust the frame size label too much, they tend to miss the details that shape the experience:
-
Fit posture: Whether the front end starts taller or lower.
-
Cockpit length: Whether the bike feels compact or stretched.
-
Practical confidence: Whether standing over the bike feels manageable.
-
Handling character: Whether the bike feels quick, calm, planted, or lively.
A bike can have the “right” size label and still be a poor match for your flexibility, riding style, or terrain. That’s especially common when someone moves between road and gravel categories, or compares a race frame to an endurance frame.
One field can’t do the whole job
Many first-time buyers hunt for a single answer. They want one number to settle everything. That’s not how geometry works. It’s a system of signals that only makes sense when read together.
Standover is a good example. It matters, especially if you’re near a size boundary or buying sight unseen. But it doesn’t define your riding position by itself. If that’s the number you tend to focus on first, it helps to understand what standover height really tells you and where it stops being enough.
The most common buying mistake isn’t choosing the wrong brand. It’s choosing the right size label and the wrong geometry.
Once you accept that, the chart gets less intimidating. You stop looking for one magic measurement and start reading the frame as a set of fit signals and handling signals.
How to Read a Bike Geometry Chart
At first glance, a bicycle geometry chart looks like a wall of numbers. In practice, most riders only need to understand a handful of fields well. The key is knowing what each field measures, what it tends to suggest on the bike, and what mistake buyers commonly make when they read it in isolation.
Start with the bottom bracket
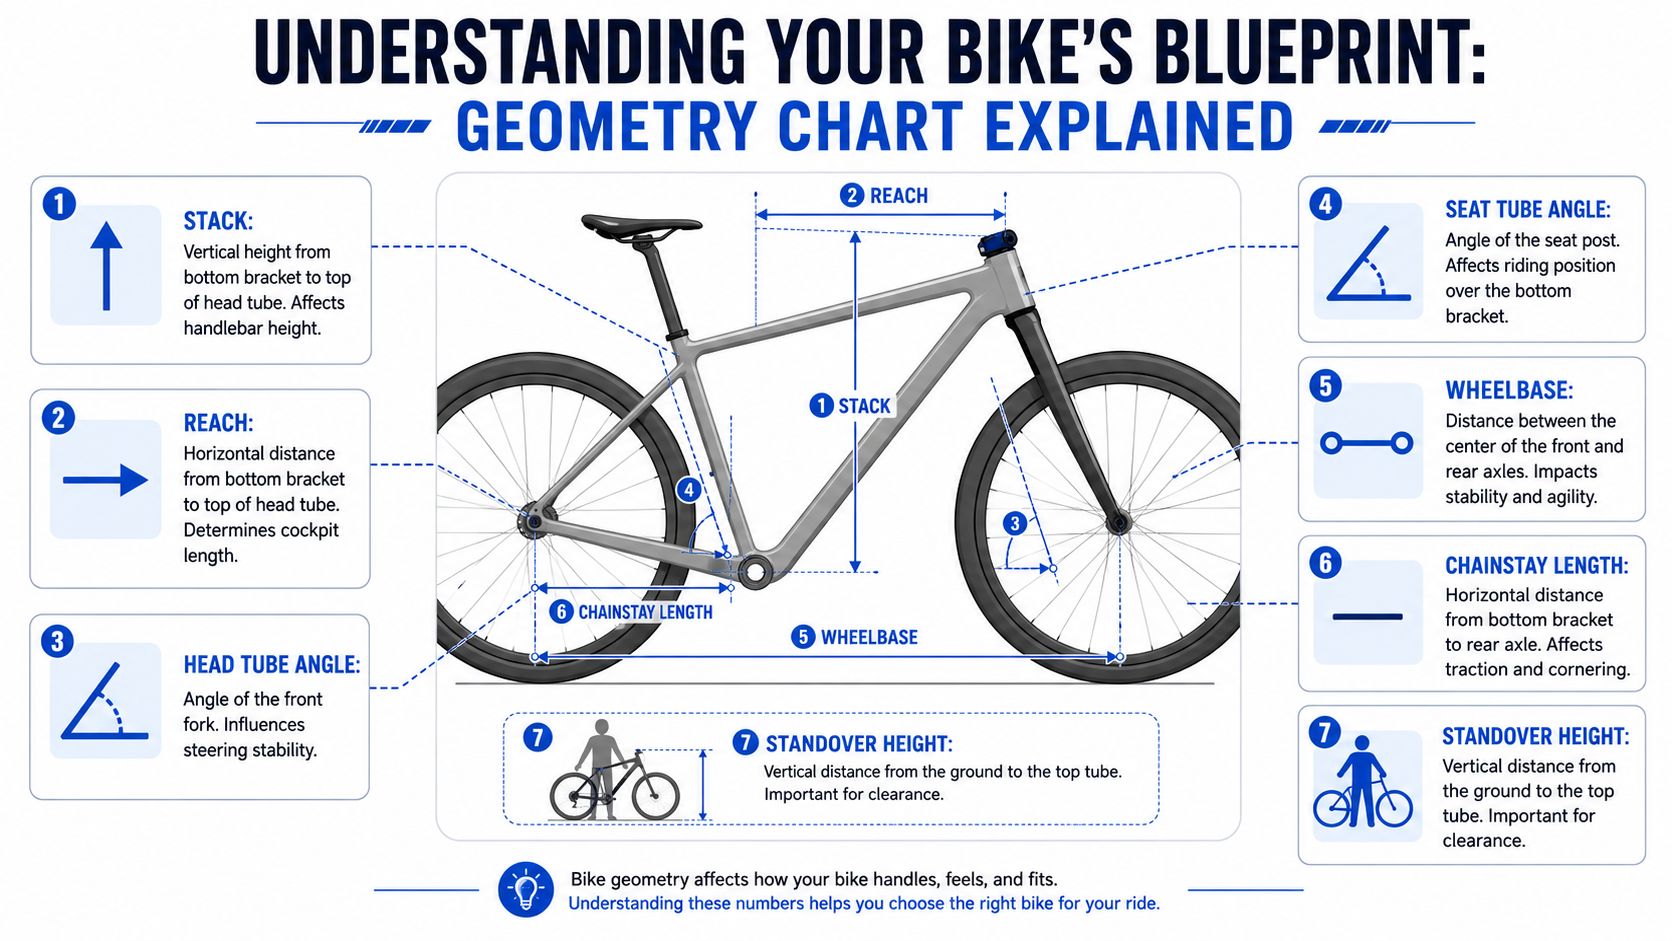
Many of the most useful bike geometry measurements use the bottom bracket as the anchor point. That matters because it gives you a stable reference for comparing one frame to another.
Stack is the vertical distance from the center of the bottom bracket to the central point at the top of the head tube, and reach is the horizontal distance between those same points. Those two numbers act like the X and Y coordinates of the frame’s cockpit and are useful because they’re independent of stem length or spacers. Small changes of 10 to 20 mm can noticeably change posture and handling, as explained by road.cc in its stack and reach guide.
That one definition already clears up a lot of confusion. Riders often think the chart is describing the final bike exactly as it will feel with every part installed. It isn’t. It’s describing the frame foundation, which is what you should evaluate first.
Bike Geometry Chart Fields Explained
| Geometry Field | What It Measures | What It Usually Tells You | Common Mistake |
|---|---|---|---|
| Frame size | The manufacturer's size label for that frame | Your starting point for narrowing options | Treating the label as a standardized fit answer |
| Stack | Vertical height from bottom bracket to top of head tube | How tall the front of the bike starts | Reading it without reach |
| Reach | Horizontal distance from bottom bracket to top of head tube | How long the frame feels through the cockpit | Reading it without stack |
| Standover | Height from ground to top tube area | How manageable the bike may feel when standing over it | Assuming it defines riding position |
| Effective top tube | Horizontal top tube reference between seat tube and head tube area | A fallback clue for cockpit length when stack and reach are missing | Trusting it more than stack and reach |
| Seat tube angle | Angle of the seat tube relative to the frame's baseline | Where the rider sits in relation to the bottom bracket | Ignoring how it changes perceived reach |
| Head tube angle | Front-end steering angle | A clue about steering character | Judging handling from this number alone |
| Wheelbase | Axle-to-axle length | Overall stability versus agility feel | Forgetting category differences |
| Chainstay length | Bottom bracket to rear axle length | Rear-end feel, stability, and tire room | Assuming shorter is always better |
| Bottom bracket drop | How far the bottom bracket sits below the axle line | A clue about ride feel and center of gravity | Overreacting to it without full context |
| Tire clearance | The maximum practical tire size the frame supports | What surfaces and use cases the bike may suit | Ignoring it because the bike “looks like gravel” |
A few of those fields deserve extra context.
-
Frame size gets you into the right row of the chart, but it doesn’t finish the job.
-
Effective top tube still helps when a seller or older manufacturer chart doesn’t show stack and reach.
-
Tire clearance often reveals what the bike really is, even when the marketing label is fuzzy.
A road bike geometry chart becomes useful when you stop asking, “What size is it?” and start asking, “What do these numbers say about the ride?”
If you’re reading a gravel bike geometry chart, the same logic applies. The chart doesn’t just tell you dimensions. It hints at whether the bike leans toward fast all-road riding, more stable mixed-surface use, or something in between.
Fit Signals Stack Reach and Standover
If you only read three numbers on a bike geometry chart, make them stack, reach, and standover.
Those are the fit signals riders ask about most often because they answer the questions buyers feel immediately. Will this bike put me low or upright? Will it feel long or compact? Will I feel comfortable standing over it at a stop?
Why stack and reach matter most
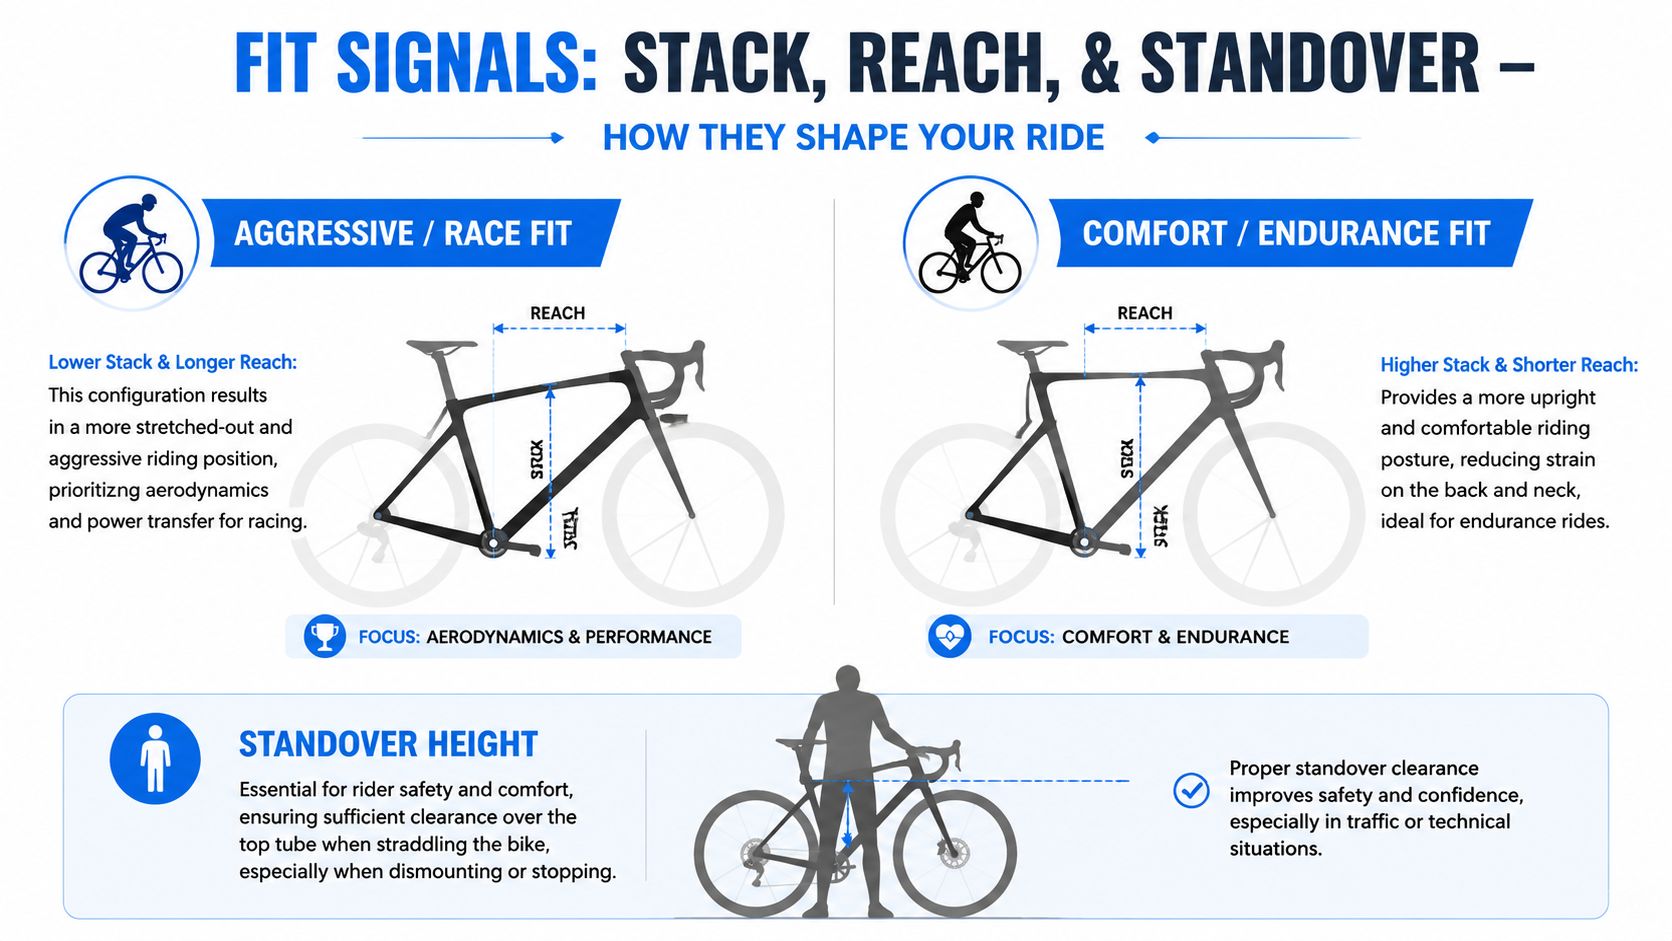
For road bikes, the stack-to-reach ratio is one of the clearest posture clues in the chart. As a rough screen, a higher stack-to-reach ratio often points toward a taller, more upright position, while a lower ratio often points toward a longer, lower, more aggressive position. Use the ratio to group bikes quickly, not to make the final decision.
That same source notes that typical road bike stack values often range from 500 mm to 600 mm, with 500 to 540 mm associated with a lower, sportier profile and 560 to 600 mm associated with a taller, more upright fit. Typical reach values often range from 360 mm to 420 mm, and a shorter reach of 360 to 380 mm creates a more compact position with less stretch on the rider’s back and arms.
Those numbers matter because stack and reach normalize comparisons across frame sizes and brands better than older shorthand like top tube length alone. Two bikes can share a size label and still be clearly different once you compare these two fields side by side.
For a deeper breakdown, use SYCLR’s guide to bike stack and reach.
Where standover fits in
Standover sits in a different category. It’s not your main posture metric. It’s your practical confidence metric.
A rider can have enough standover room on a bike that still feels too low and too long once they start riding. The reverse can happen too. That’s why standover belongs in the first pass of chart reading, but not as the final answer.
Use it to ask practical questions:
-
Stops and starts: Does the frame seem manageable when you come off the saddle?
-
Size boundary decisions: If you’re between sizes, does one option look less intimidating on paper?
-
Remote buying confidence: If you can’t test ride, does the bike at least clear this basic confidence check?
The useful sequence is simple. Read stack and reach first for riding position. Read standover next for standing-over-the-bike practicality.
Handling Signals Angles and Lengths
A geometry chart starts to feel useful when you stop asking, “What does this term mean?” and start asking, “How will this bike behave under me?”
That shift matters. Fit numbers help you judge position. Handling numbers help you judge personality. They tell you whether a bike is likely to feel calm or eager, steady or twitchy, planted or lively once the wheels are rolling.
Many first-time buyers latch onto one headline number, usually head tube angle, and treat it like the whole answer. That usually leads to bad comparisons. Handling comes from several measurements working together, much like reading a map. One road name is not enough. You need the full layout to know where you are going.
Front-end signals
Head tube angle is a starting point, not a verdict.
In broad terms, a steeper head tube angle tends to produce a quicker steering response. A slacker angle tends to feel more stable, especially when speed picks up or the surface gets loose. That basic pattern is helpful, but it only gives you part of the picture.
Two bikes can share a similar head tube angle and still steer differently because trail, fork geometry, tire size, and intended use all shape the result. A road race bike, an endurance bike, and a gravel bike may post numbers that look close on paper, yet the steering feel can be quite different once you account for the rest of the front end.
If you are scanning a chart as a buying tool, the useful question is not “Is this angle aggressive?” Ask, “Does this front-end setup match the kind of riding I do?”
Rear-end and full-bike signals
The calmer clues often sit lower in the chart.
-
Wheelbase: A longer wheelbase usually brings more stability and a more settled feel, especially on rough pavement, gravel, or fast descents. A shorter wheelbase usually makes direction changes feel quicker.
-
Chainstay length: Shorter chainstays often make the rear of the bike feel more responsive when you accelerate or change line. Longer chainstays usually add composure and often show up on bikes built for wider tires, added traction, or more loaded riding.
-
Bottom bracket drop: This affects how high or low the rider sits relative to the axles. More drop often gives a bike a lower, more planted cornering feel. Less drop can increase pedal clearance, which matters in some off-road situations.
Seat tube angle belongs here too. Riders often file it under fit, but it also affects handling feel because it changes where your weight sits over the bike. A steeper seat tube angle places you more forward over the bottom bracket. That can support efficient pedaling and shift more weight toward the front wheel. A slacker angle moves you farther back, which can change front-wheel load and alter how the bike feels on climbs, seated efforts, and longer rides.
Read those numbers as a package.
A bike with a slack head tube angle, long wheelbase, and longer chainstays usually points toward stability. A bike with a steeper head tube angle, shorter wheelbase, and shorter chainstays usually points toward quicker reactions. Neither is better by default. The better choice depends on whether you want confidence at speed, agility in tight turns, comfort on mixed surfaces, or a sharper road feel.
That is why vague category labels can mislead. Terms like “all-road” or “gravel-ready” only help so much. The chart gives you a better working picture of how the bike is likely to ride.
Common Bike Geometry Chart Mistakes to Avoid
A bike geometry chart only helps if you read it cleanly. Most buying errors come from rushing to one number, one label, or one assumption.
Mistakes that change the shortlist
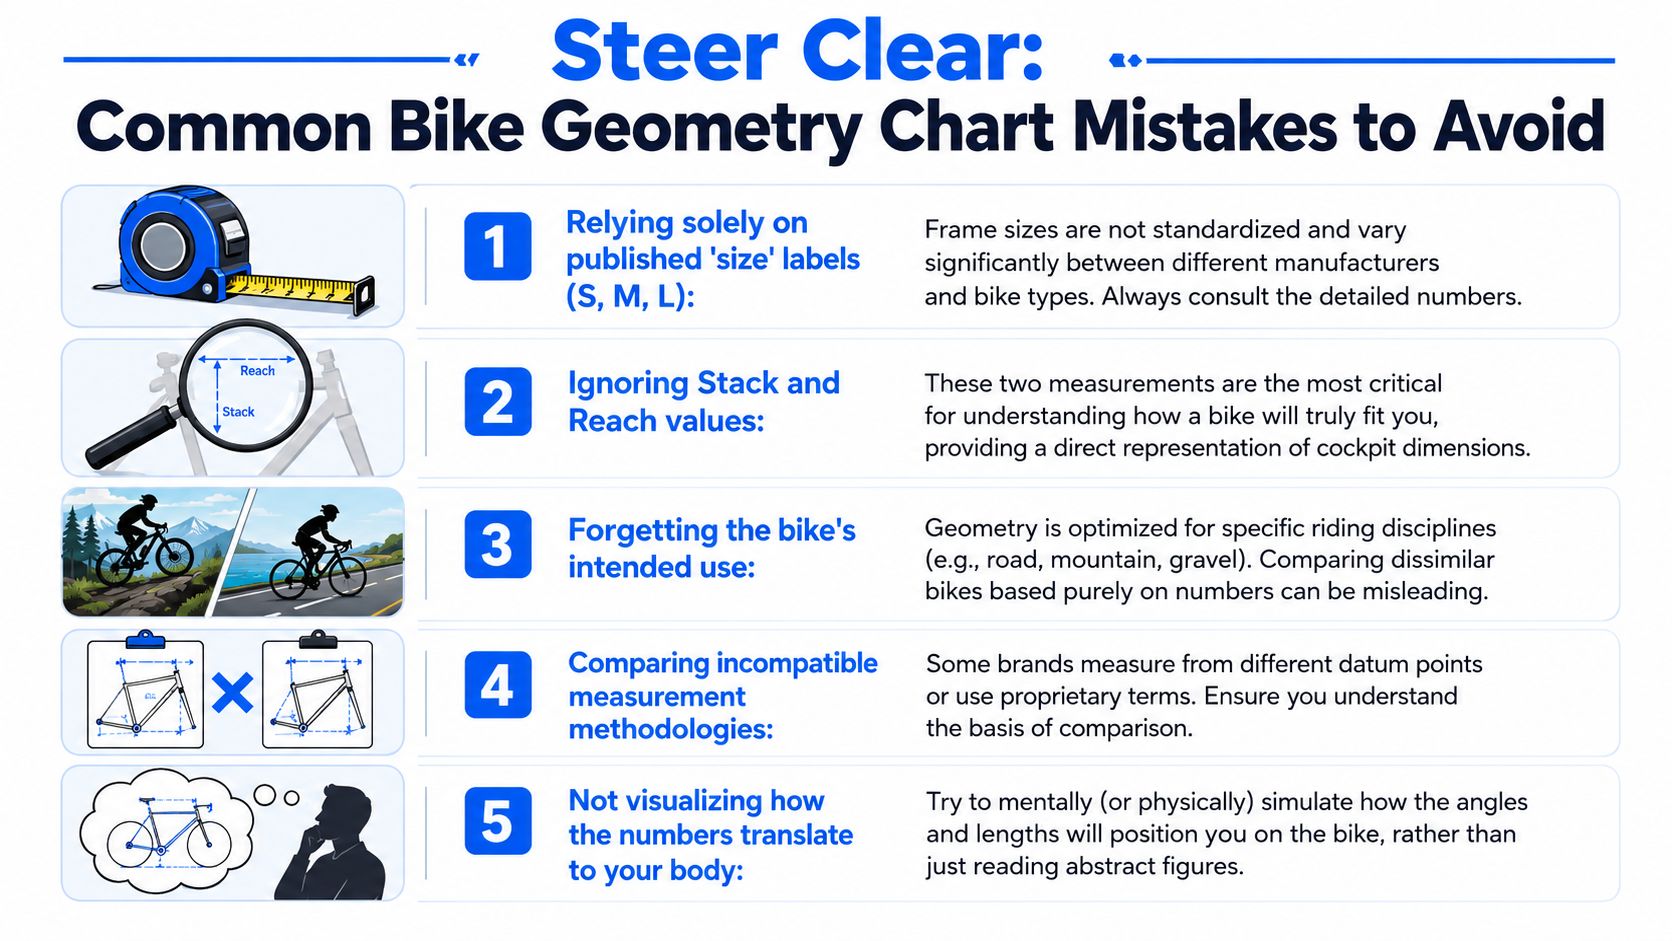
The first mistake is the biggest one. Treating frame size as the final answer. A 56 in one model can ride very differently from a 56 in another. Even within one brand, category changes can reshape the fit.
The second is splitting up stack and reach. Riders often read one and ignore the other. That breaks the chart. A tall stack with a long reach can feel very different from a tall stack with a short reach. The pair matters more than either number alone.
The third is over-trusting effective top tube. It’s still useful when stack and reach are missing, especially on older charts or used listings. But it can mislead if you ignore seat tube angle, stem choice, and the rest of the cockpit.
Other mistakes are more subtle:
-
Judging handling from head tube angle alone: You need wheelbase, trail, chainstay length, and bike category for context.
-
Forgetting model year: Geometry can change across model years even when the bike name stays the same.
-
Ignoring the complete build: Stem length, spacers, handlebars, saddle position, wheels, and tire size all influence the final feel.
-
Skipping tire clearance: A gravel bike with limited clearance may not fit the riding you have in mind.
The chart describes the frame foundation. The build finishes the picture. Don’t confuse one for the other.
A good habit is to treat every geometry number as a clue, not a verdict. The more a number seems to promise on its own, the more likely it needs context.
How to Compare Charts and Shortlist Bikes with SYCLR
When you compare two bikes, open their geometry charts side by side and stay disciplined. Don’t bounce between marketing pages, seller claims, and geometry tables without a system.
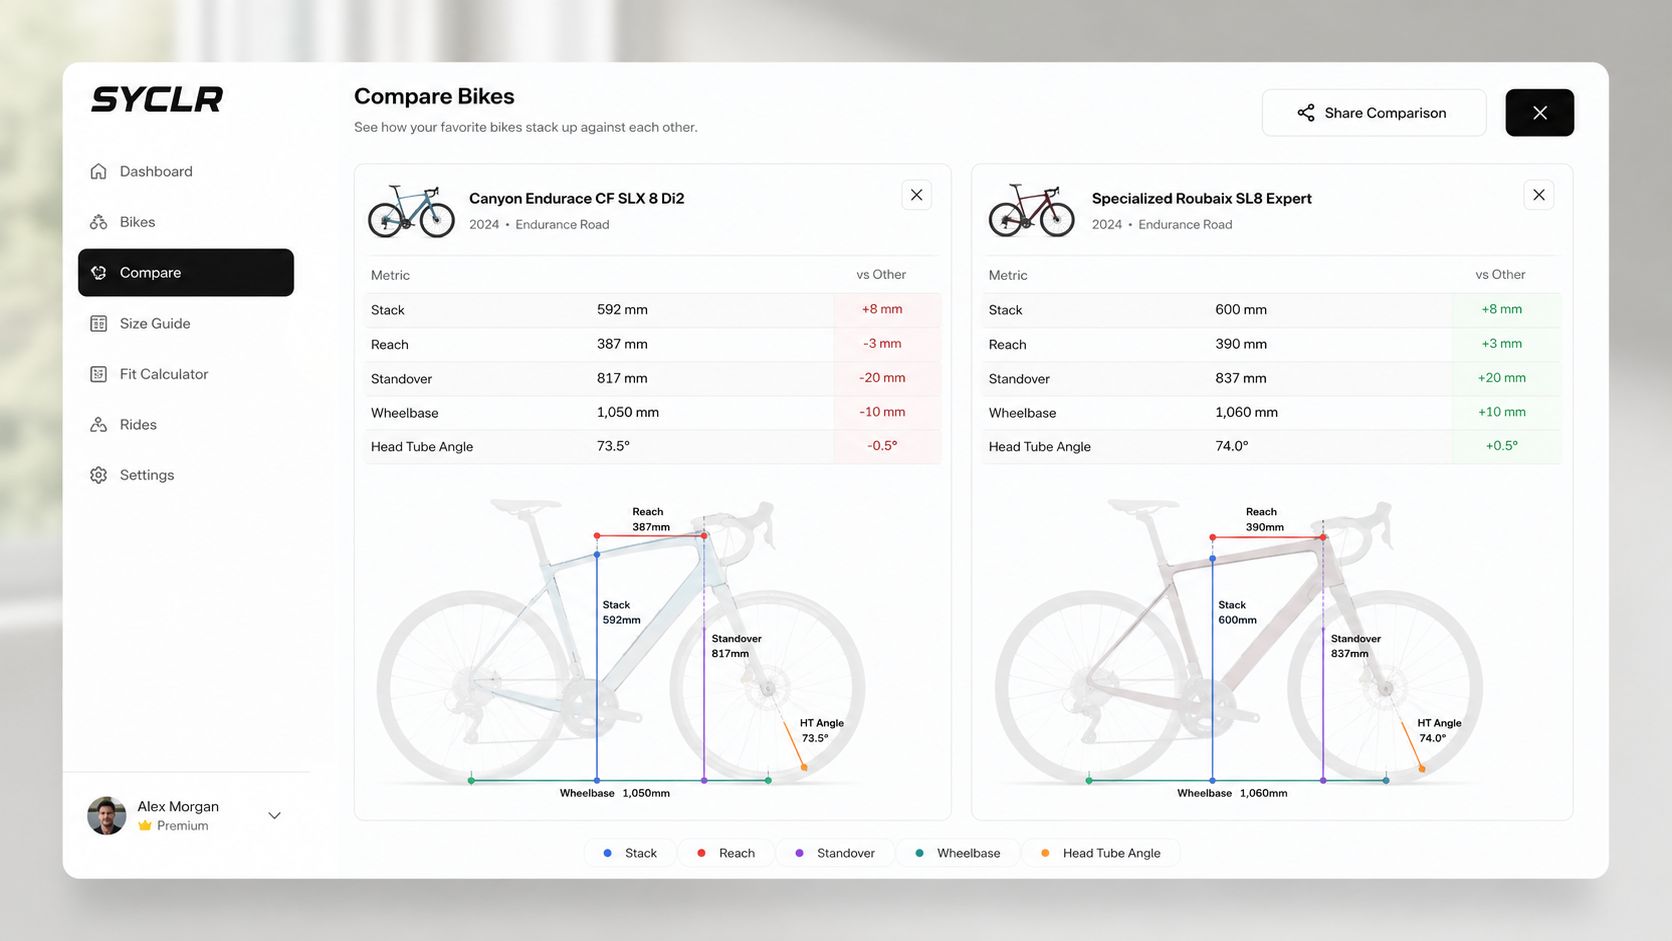
A practical comparison workflow
Start with the row that matches the size you’re considering. Then move through the chart in this order:
-
Check stack and reach first. These are your main geometry signals for rider position.
-
Check standover next. Use it as a practical confidence check, especially when buying online.
-
Use effective top tube as backup. It helps if stack and reach are missing, but don’t let it override better data.
-
Read the handling cluster together. Head tube angle, wheelbase, chainstay length, and bottom bracket drop should be read as a set.
-
Check tire clearance last. This often confirms whether the bike matches your actual surfaces and plans.
If you want to see how this works in a broader head-to-head context, SYCLR’s article on compare bike geometry across listings and categories is the right next step.
Quick chart-reading checklist:
-
Start with the correct model year and size row.
-
Compare stack and reach together.
-
Check standover for practical confidence.
-
Use effective top tube only as a backup when stack and reach are missing.
-
Read head tube angle, wheelbase, chainstay length, and bottom bracket drop as a handling cluster.
-
Check tire clearance against the riding you actually plan to do.
-
Remember that stem, spacers, bars, saddle position, wheels, and tires complete the final setup.
When you’re doing this manually, the process works. It’s also slow. You’re checking geometry signals, model year context, price context, listing quality, and whether the source gives you enough detail to trust what you’re seeing.
That’s where SYCLR fits. Riders can use the SYCLR app to compare road and gravel bike listings with fit-aware recommendations, geometry signals, listing confidence, model year context, and price context in one place. If you already know your current-bike geometry, stack and reach, or other fit details, SYCLR’s fit-details entry gives you a more refined starting point.
Bike Geometry Chart FAQ
What is a bike geometry chart?
A bike geometry chart is a table of frame measurements that helps explain how a bike may fit, handle, and match a rider’s intended use. It usually includes frame size, stack, reach, standover, head tube angle, wheelbase, chainstay length, bottom bracket drop, and tire clearance.
Which bike geometry numbers matter most?
Stack, reach, and standover are usually the first three numbers to check. Stack and reach explain rider position, while standover helps with practical confidence when standing over the bike.
Is frame size enough to choose a bike?
No. Frame size is only a starting point. Two bikes with the same size label can have different stack, reach, handling geometry, tire clearance, and ride feel.
What does stack mean on a bike geometry chart?
Stack is the vertical distance from the bottom bracket to the top of the head tube. It helps explain how tall or low the front of the bike starts.
What does reach mean on a bike geometry chart?
Reach is the horizontal distance from the bottom bracket to the top of the head tube. It helps explain how long or compact the frame may feel through the cockpit.
What geometry numbers affect bike handling?
Head tube angle, wheelbase, chainstay length, trail, bottom bracket drop, and tire clearance all help explain handling. These numbers should be read together, not as isolated verdicts.
Can SYCLR help compare bike geometry charts?
Yes. SYCLR helps riders compare road and gravel bike listings using fit signals, geometry signals, model year context, price context, listing quality, and confidence signals so they can shortlist better-fit bikes before they buy.
If you are comparing road or gravel bikes now, start with your height, bike type, and budget in the SYCLR app. SYCLR helps you compare listings by fit signals, geometry signals, model year context, price context, listing quality, and confidence signals so you can shortlist better-fit bikes before you buy.
Already know your current-bike geometry, stack, reach, or fit-report details? Use your fit details to improve your recommendations.